Job Designer and More - 0.962 Release

The job designer (#171) is the main feature in 0.962 release.
Besides that, it contains:
- support for multiline shell scripts and selecting shell executable (#183 and #184) charts
- new chart showing flows duration in a branch (#173)
- multiple new base docker images for various programming languages
- split results chart to pass ratio chart and passed/total chart (#187)
More information about these changes is below.
Job Designer
Now it is possible to design job steps using a UI available on a branch management page.
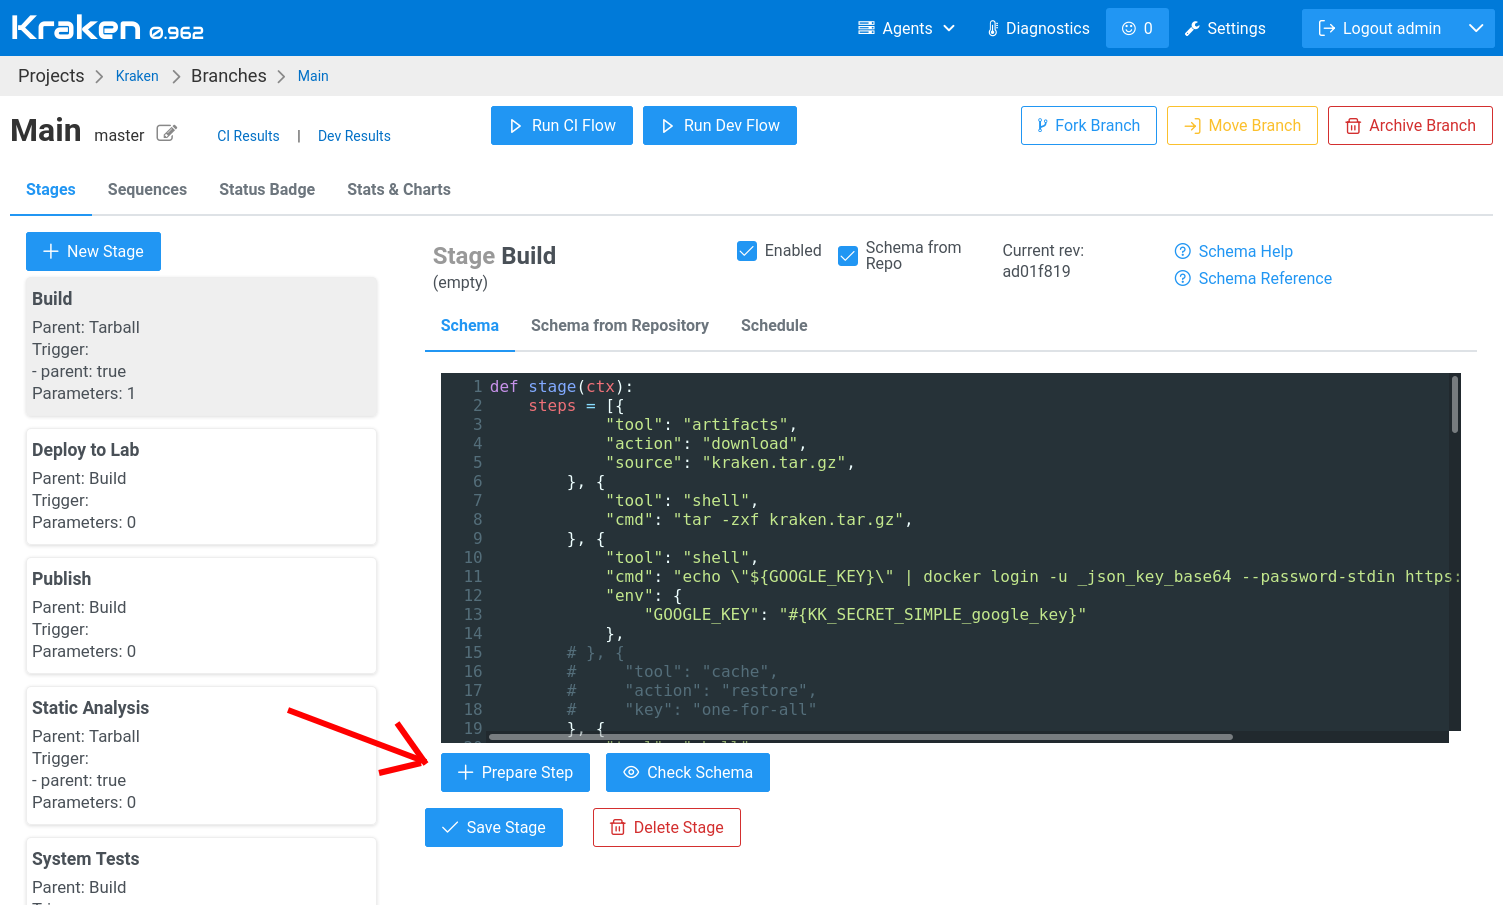
The Prepare Step button shows the job designer dialog.
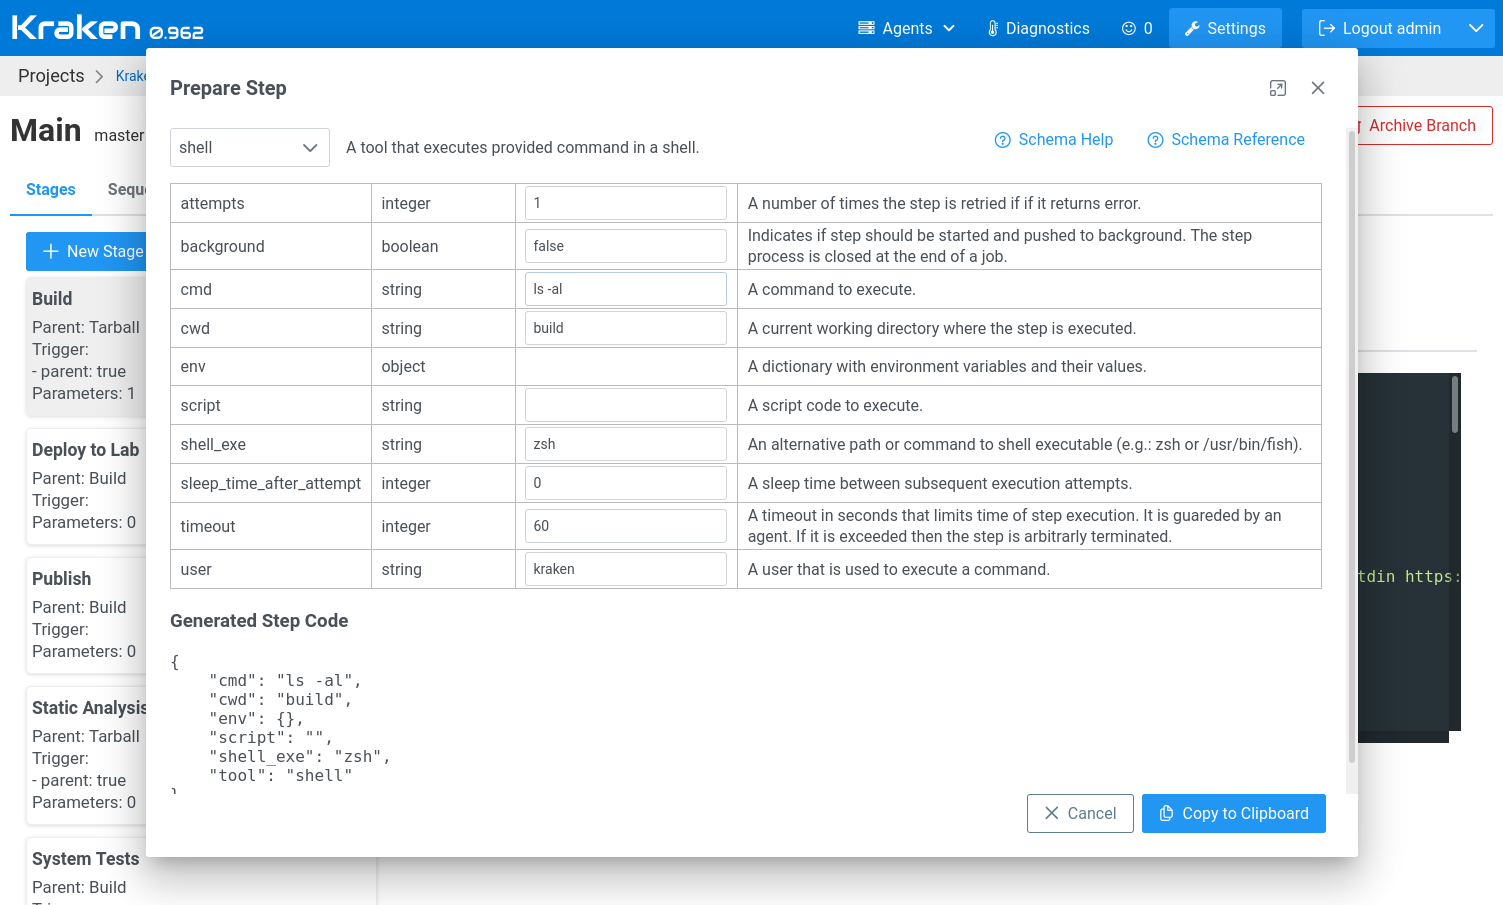
The dialog shows all available fields of a step with descriptions and input boxes pre-filled with default values. These fields are available for a tool selected in the dropdown at the top of the dialog. Below, there is the step generated in JSON format.
In the case of the picture above, there is a shell tool
selected. There are multiple fields available. A few are used:
cmd, cwd and shell_exec. The generated step in JSON contains
these fields with user-provided values.
Now a user may copy the generated step and then paste it into the stage schema code.
Shell Tool Improvements
The shell tool got two improvements. One allows for entering a multiline
script instead of just one command. The other one allows for indicating
an alternative shell executable - the default one is /bin/sh.
A multiline script can be provided in the following way:
{
   "steps": [{
       "tool": "shell",
       "script": """
           echo 'multiline script'
           ls -al
           echo 'completed'
       """
   }]
}
Changing default shell executable to e.g. zsh goes this way:
{
   "steps": [{
       "tool": "shell",
       "cmd": "echo $ZSH_VERSION",
       "shell_exec": "zsh"
   }]
}
More in the docs.
Flow Duration on Branch Chart
On the branch management page, on Stats and Charts tab, there are
basic stats about the branch, like the total number of flows or the
average flow duration in the last week. Below these stats, a chart
shows the duration of flows over time.
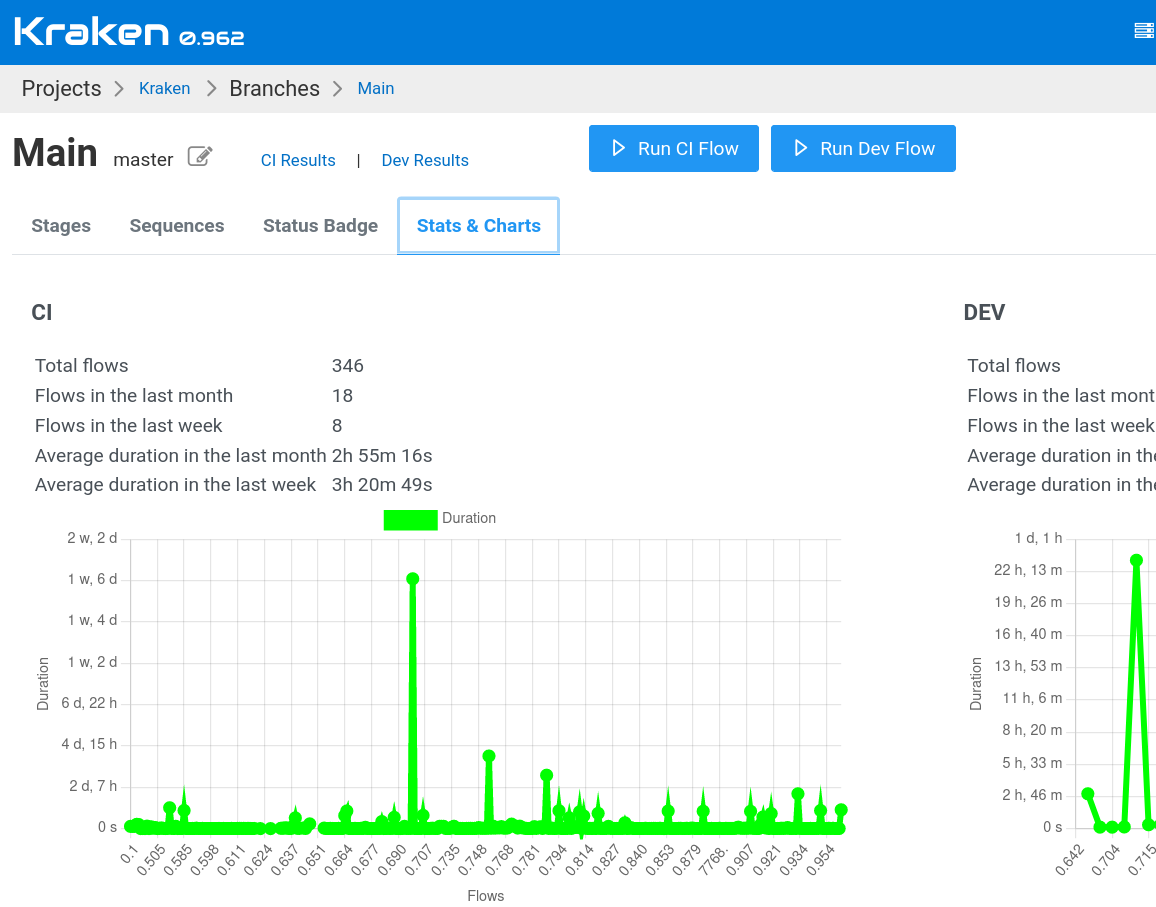
The whole stats and charts are presented in two instances: one for CI and the other one for DEV flows.
New Base Docker Images
There are multiple new Docker images prepared to be used in Kraken CI. The full list is available in the docs page.
Split Results Chart
Initially, the pass ratio was shown together with total and passed counts on the same chart. Now that is split into two charts: 1) pass ratio chart and 2) total and passed counts.