Test Results Tracking
Intro
ISTQB defines several goals for testing. Two of them that are pretty important are:
- To find defects and failures thus reduce the level of risk of inadequate software quality.
- To provide sufficient information to stakeholders to allow them to make informed decisions, especially regarding the level of quality of the test object.
At first glance, these goals do not seem that hard. In small projects, it is pretty easy to achieve. Not many tests and not many code changes do not generate much work to analyze and reason.
In the case of bigger projects, where testing is performed even several times a day, and where test content contains thousands or tens of thousands of test cases and where the number of combinations of environments (like operating systems and various types of hardware) and configurations is high, tracking and monitoring tests results gets really difficult.
Proper tools must be employed to match these expectations that will automatically do much of this analytical work. Basic tests results reporting is not enough. More sophisticated analysis is required. The following sections present tools and features in Kraken CI that help in this area.
Result Changes in the Last Flow
The basic approach to testing is observing results. The results include passes, failures, errors and sometimes some other types of status. Looking at failures and errors allows for finding some problems, these lead to some debugging, root-casing, defect submission and fixing eventually.
Observing a list of results from subsequent test sessions for subsequent product builds is not easy anymore. Again, there are some failures, but which were also present in the previous build and which are new regressions? In the case of small projects with a handful of tests, it is easy to go back to previous results and compare and manually find out what has changed. If there are tens or hundreds of failures, then a feature is needed to spot regression or fixes compared to the previous build.
New button
In the case of Kraken CI, the table with test case results allows
immediately for filtering and showing only these results that are
regressions or fixes. For that purpose, a New button shows only the
test cases that changed the status in the current build compared to
the previous one, i.e. shows "new", interesting results that require
some attention.
The screenshot above shows the New button and filtered results list.
The two first test case results indicate a regression and a fix.
This way, we can focus only on results that indicate some changes and
ignore the failures that are there for weeks or months because they
were not fixed yet.
Filter by Result Change
It is possible to do more fine-grain filtering and select a particular
change, e.g., regression or fix. For this purpose, there is a
dropdown Result Change.
The screenshot shows selecting regressions only. So now we can focus
only on a negative aspect of result changes.
Instability
Even if only the regressions are presented, some tests are still not
interesting or maybe interesting but for different reasons. These not
interesting results are sporadic or unstable tests. Sometimes a test
case passes, sometimes it fails. It changes its results status quite
often. It can be concluded that this is all the time the same problem:
either there is a bug in the product or in the test. If this is a
known problem, it is better to filter out such results. This is
possible by filtering results by their instability. There is a column
called Ins. (for instability) that shows a count of status changes
in the last 10 builds. If it is equal to 9 it means that it was
flipping from passed to failed, back and forth. So using a slider in
the filtering pane, the instability can be narrowed to, e.g. 0-3
range.
This screenshot shows results filtered by instability that is set to
range 0-3. Now it is visible in the Instability column that it is 1
i.e. the regression is new, and in the past 10 builds, the test cases
were stable and passed.
In the previous case and previous screenshot, this column was showing 9. Let's get back to this situation and click such a test case to check its details.
This screenshot presents a table with the historical results of the
selected test case. At the top, there is the latest result in the
first row. The Result column shows result statuses. It is visible
now that the status was constantly changing in the last results. The
Age column shows 0, i.e. every time the result was new. The
Instability column is all the time high. Such test case require some
investigation and either fixing or removing from the test scope.
It is possible to switch the view to a chart by selecting the second
tab at the top of the page: Charts. Here it is also visible that the
results are pretty unstable.
Relevancy
Another way for getting important results is sorting them by
relevancy. This is a metric built on properties of particular
results. The higher the relevancy is, the more important the result
is.
This relevancy score is calculated as follows:
+1if the result is not passed+1if there is no comment attached to the result ie. it is not root-caused yet+1if the result is failure+1if the result was pretty stable (so it is the same over several test runs), ie. instability is<=3+1if the result is rather recent (the age is < 5) ie. ignore old failures+1if this is a regression
Max relevancy is 6. So more interesting results are recent
regressions that till now were pretty stable and are not root-caused
yet.
Comments
To remember the conclusions of investigation of given failure it is good to store them. For that purpose, there are test case comments.
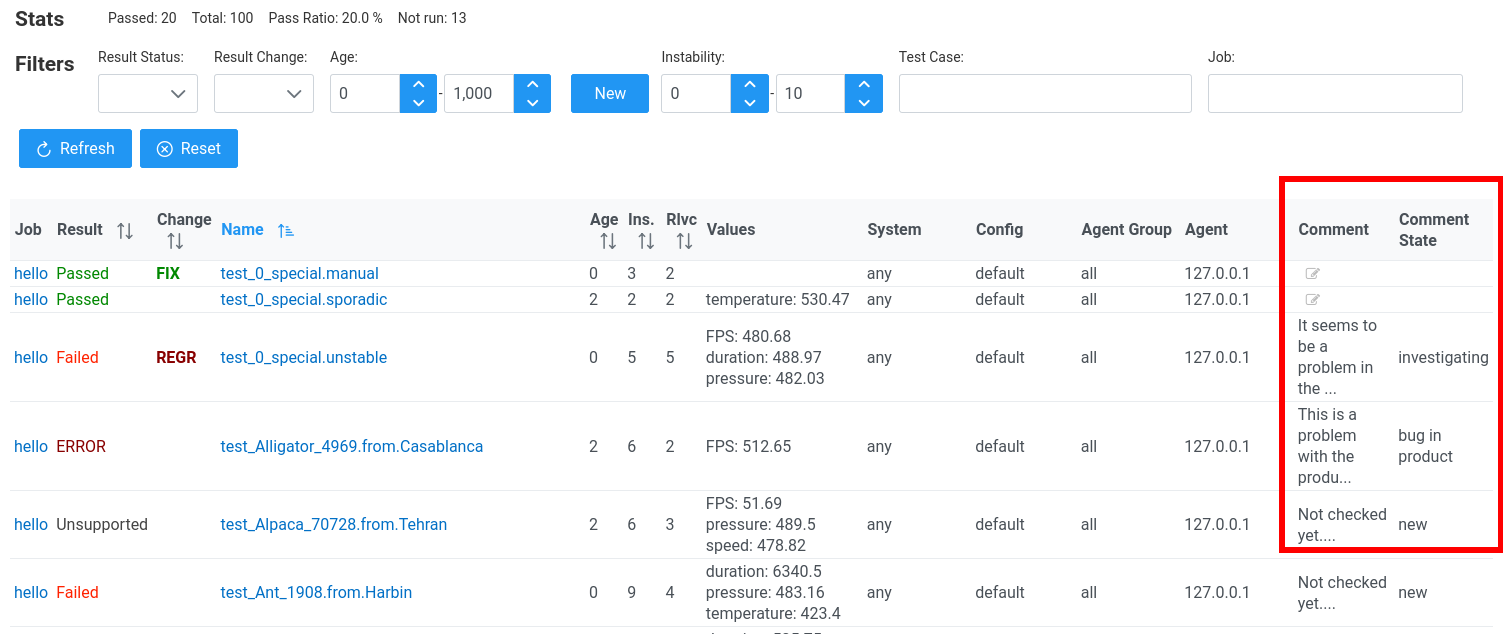
There are two columns on the right side of the results table related to comments. Clicking a given cell allows for entering a comment a state. The state may indicate if the problem has been root-cased or not. This way, the next we get the results for this same test case, we will already see the comment and conclusions we made previously.
Finding Changes in the Past
It is hard to spot regressions if the results are not analyzed immediately after tests execution. The failures are getting stable, so it is not visible as regressions anymore. To find such results, results that were regressions during, e.g. last week, we need to filter by age. Age allows filtering results that are not recent but happened in the near past. If, e.g. we set age to 1-5 range, then the test case results table will show results that persist (are stable in the last 1-5 runs) the change happened in the previous 1-5 executions. This allows for filtering out recent failures (because e.g. we already have analyzed them) and very old, stable results (because e.g. no one cares about them anymore).
This screen shows results filtered by age from 2 (since 2 builds ago) to let's say infinity. The table at the bottom contains now only a handful of results with age 2 or 3. This way, we can find not current regressions but still quite recent.