Test Results Basics
Branch Results
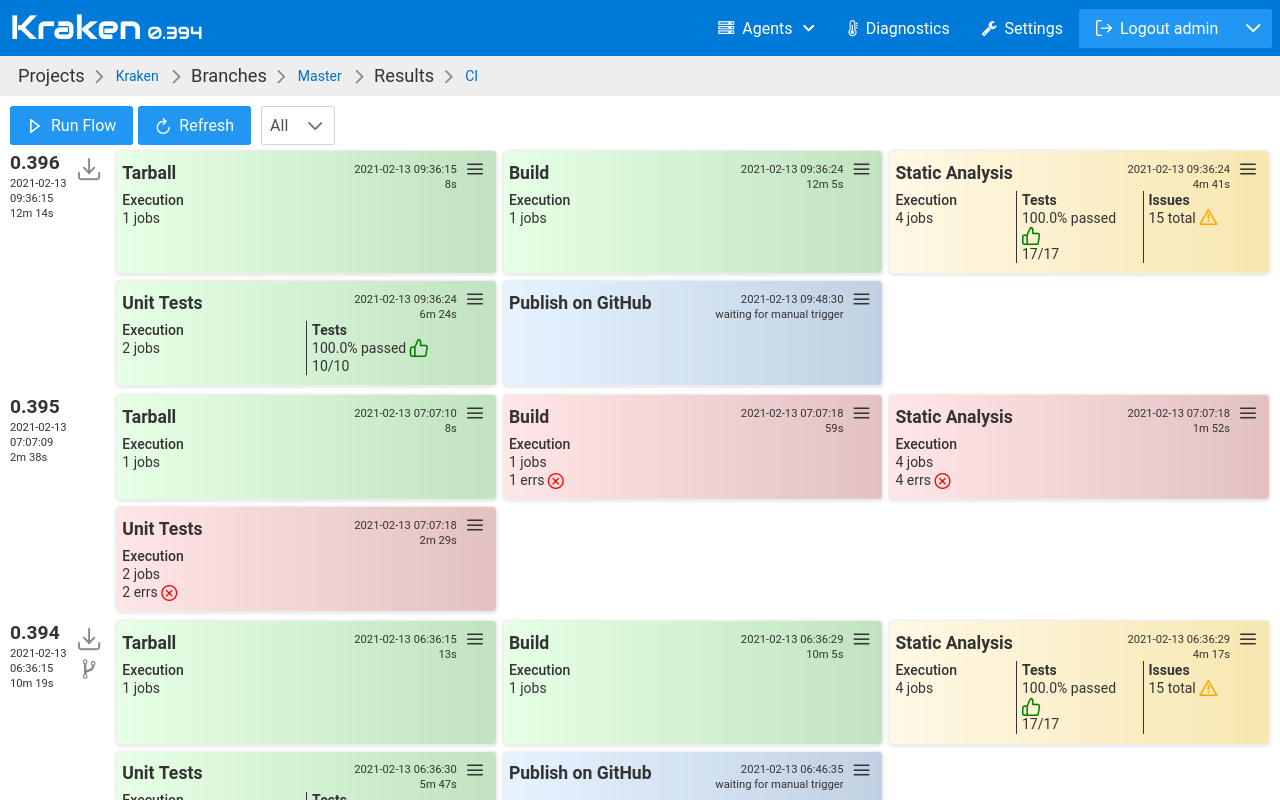
The Branch Results page presents high-level information about the
flows and runs of a given branch. It organizes flows in rows. The top
row contains the latest flow. Each flow row contains a list of
boxes. Each box contains information about a run of a given stage. The
order of boxes with runs is chronological according to their start
time.
Run Box
The color of the run box indicates the final status of the run:
- red: one or more jobs finished with an error
- yellow: no errors in jobs but some test results failed or there are issues discovered in the code
- green: all jobs finished without error and there are no failures in tests and no issues in the code
A run box contains:
- data about execution: total number of scheduled jobs, number of erred jobs, etc.
- summary of testing: pass ratio, total, regressions and fixes counts, etc
- issues summary: total number of discovered issues, number of new issues
Example 1:
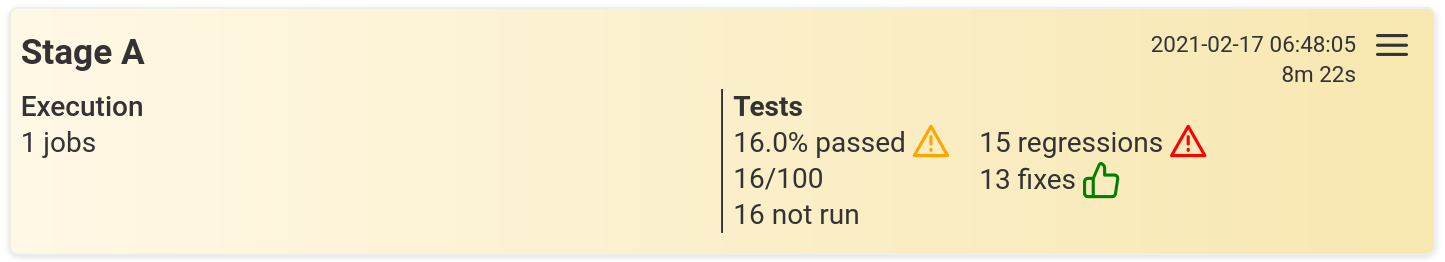
This run has 1 successful job that reported tests results. There were 100 test cases run, where 16 did not pass, so the pass ratio is 16%. There were detected 15 regressions and 13 fixes. There are failures, so the box is yellow.
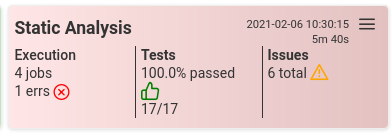
Example 2:
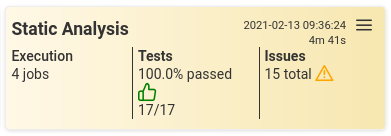
This run has 4 jobs with no errors. Some of them reported tests results, the other ones reported issues. There were 17 test cases run, all passed, so the pass ratio is 100%. There were detected 15 issues in the code. There are issues, so the box is yellow.
Example 3:
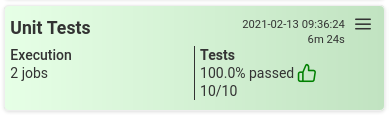
This run has 2 jobs with no errors. In the reported tests results, there are 100% passed test cases. No failures and no issues, so the box is green.
Example 4:
This run has 4 jobs with 1 error. All tests reported are passed but there could be not reported tests due to errors in job execution. There were detected 6 issues in the code. There is one erred job so the box is red.
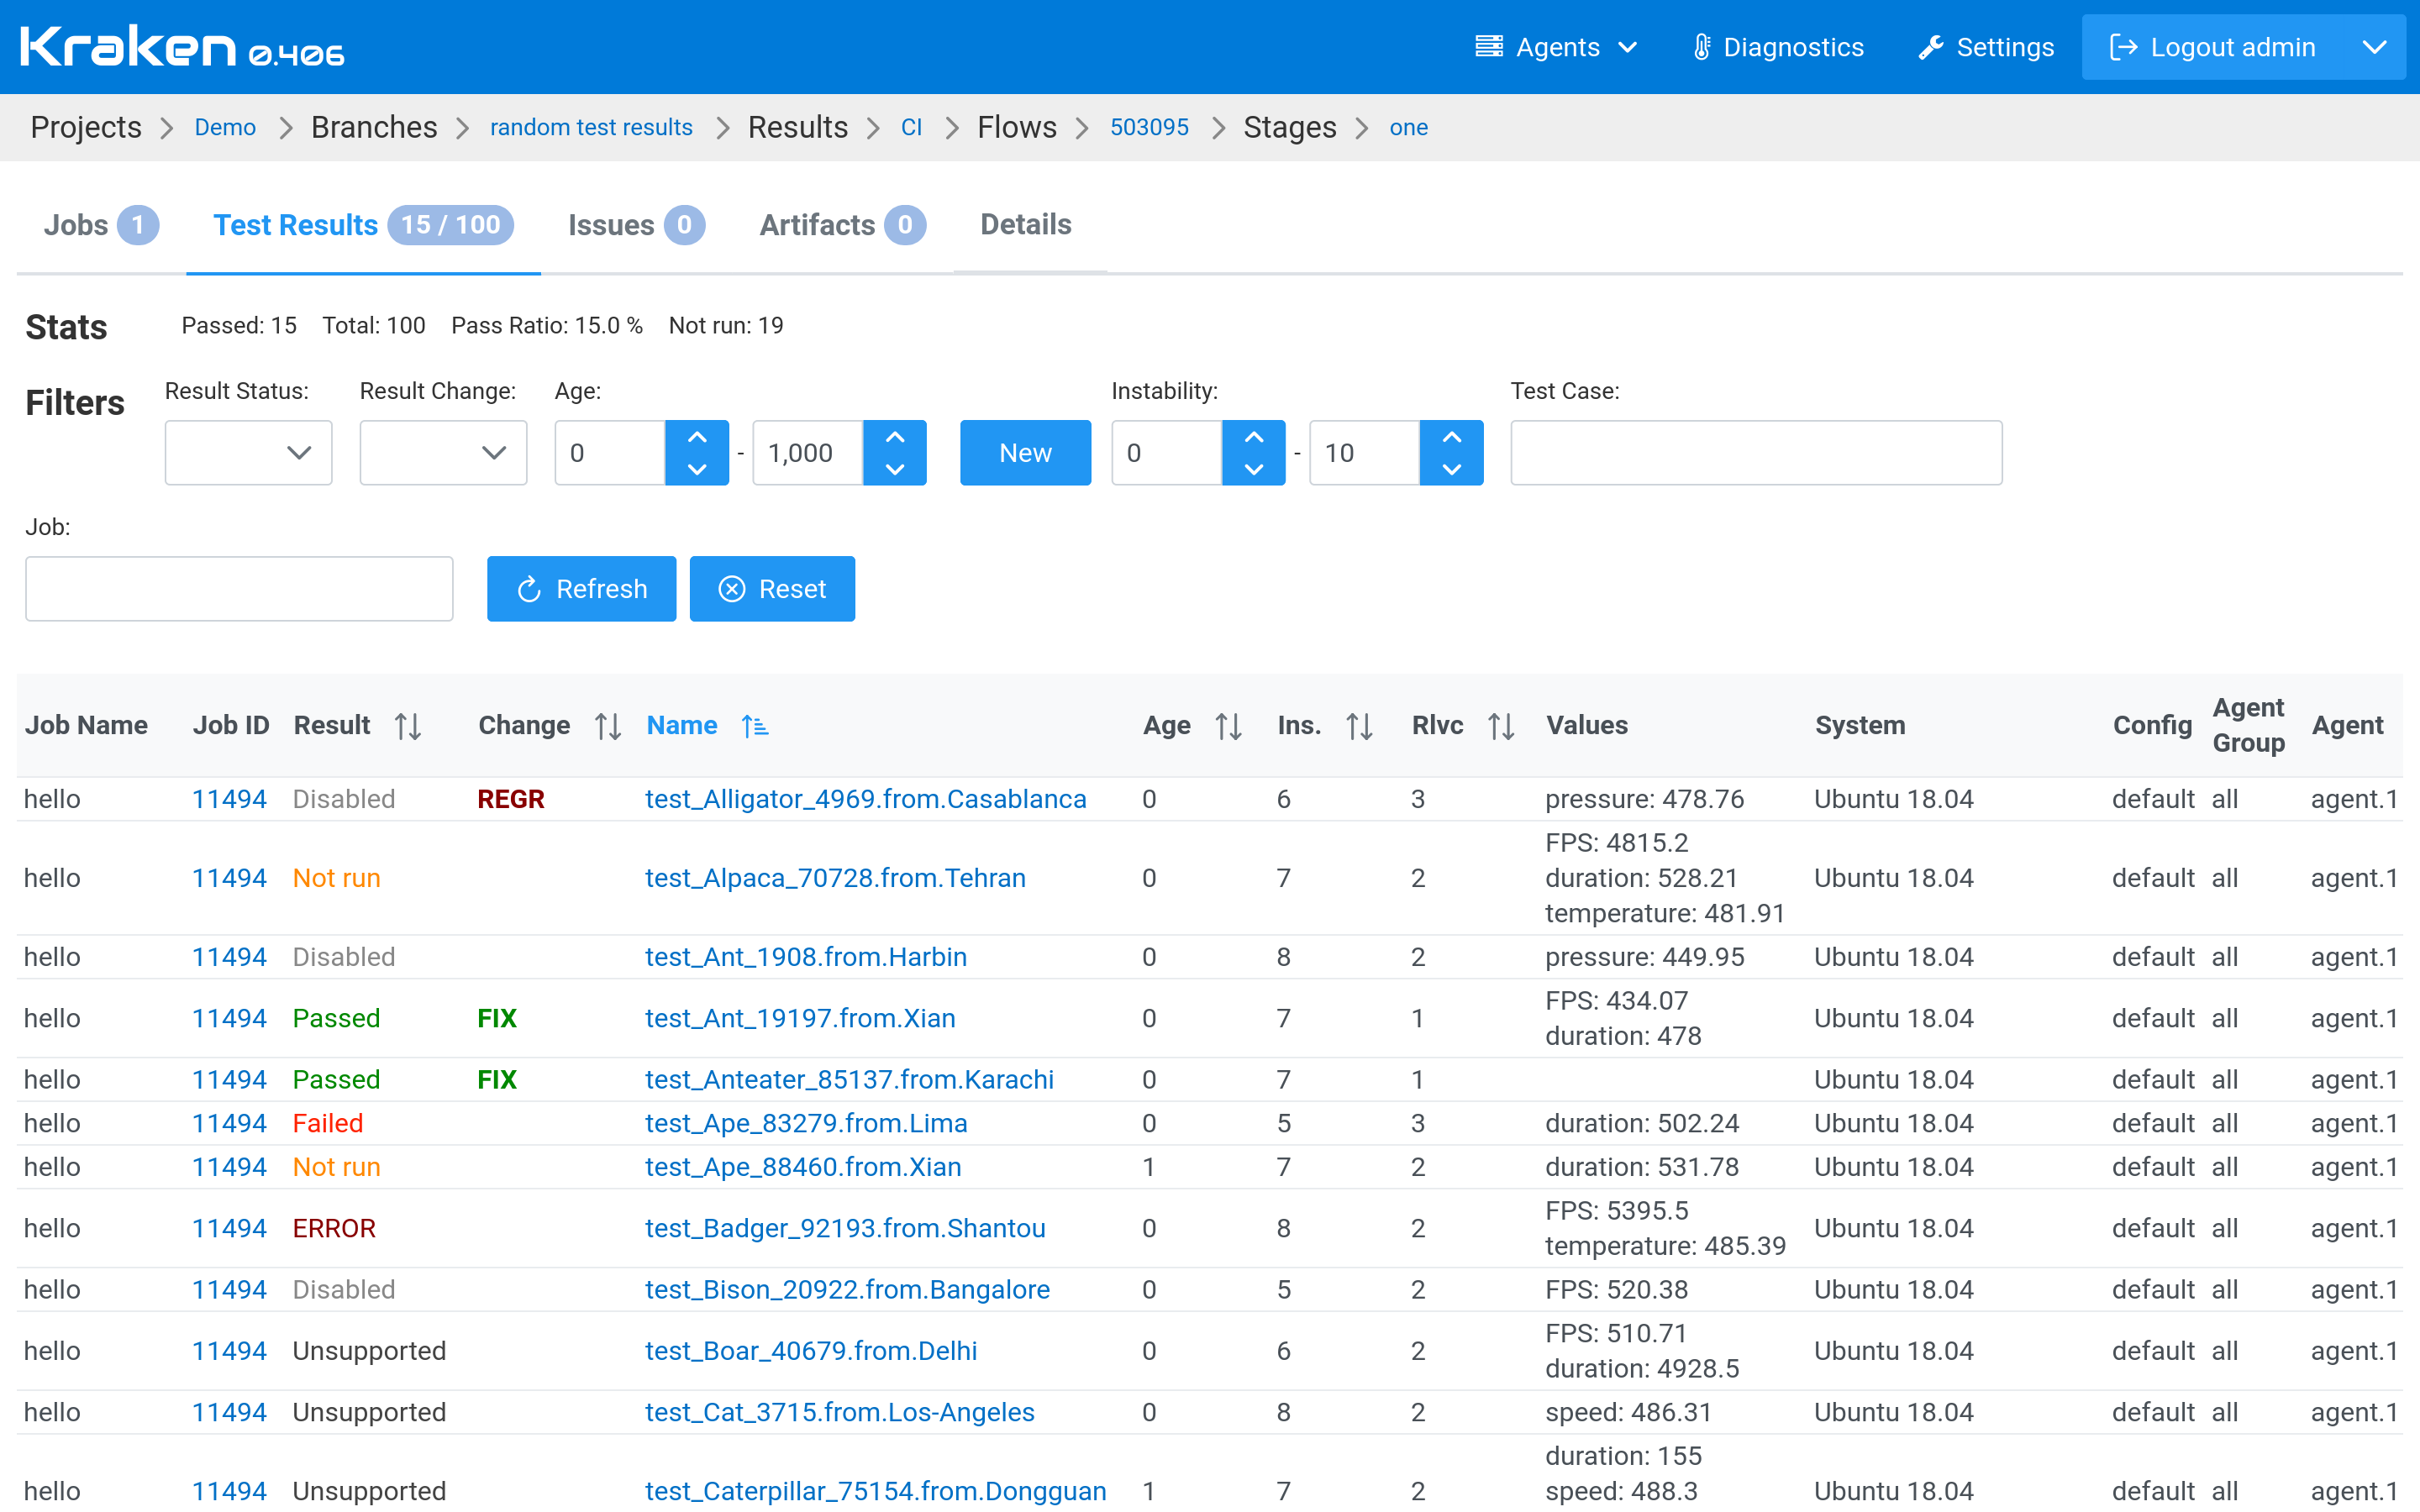
Test Case Results Table
A job that performs testing reports test results. The test results are
visible on a Run Results page, in Test Results tab. They are
presented in a table.
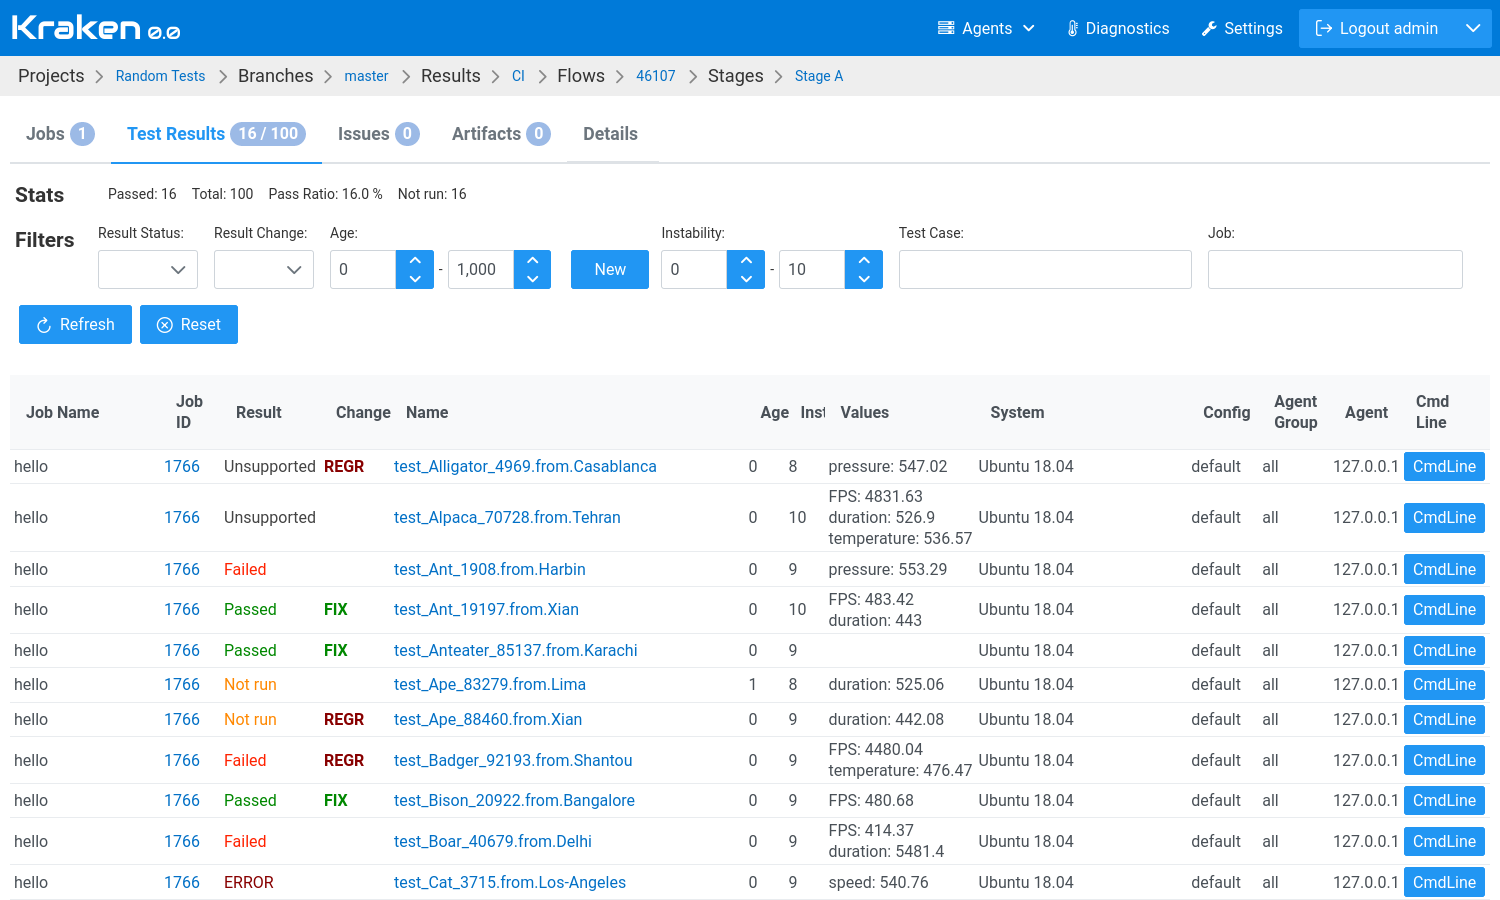
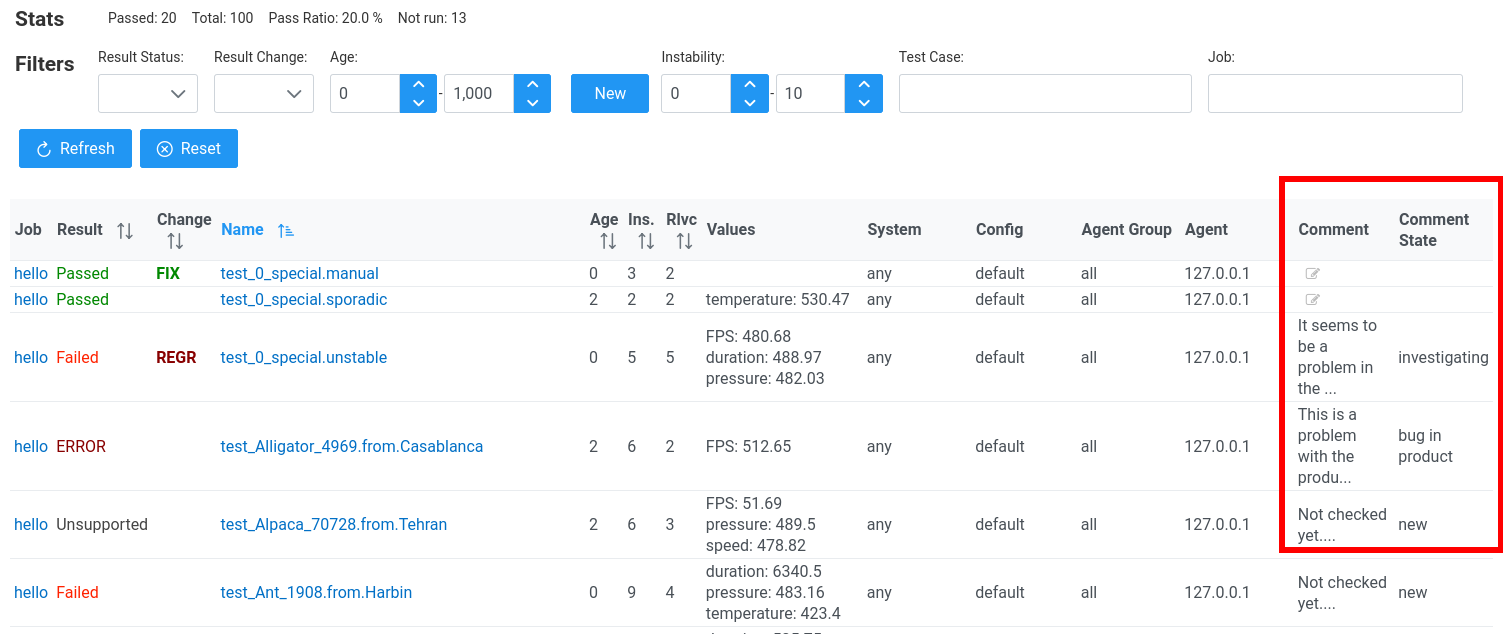
The table presents test case results in each row. They contain details of the test case result:
- the result status
- a name of the test case
- job name and ID
- age, instability and relevancy
- values
- execution environment: system, agent group and actual agent and config
In Kraken, a test case result besides status can contain values. Values are pairs: attribute and its value. They are also a result of a test case but hold numbers. They can hold e.g. performance data or anything similar to performance. These values are tracked over time. Kraken can draw charts of values and do more things with them.
Filtering Test Case Results
It is possible to filter test results by various attributes:
- by
Results Statusie.Passed,Failed, etc. - by
Result Changeie.Fixes,Regressions,NewandNo Changes; the change is determined between the current result and the previous result from previous run - by
Agewhere age is a number of previous runs with the same result as in the current run; so e.g. age 0 means that in the previous run test case had a different result than it has now (so these are regressions and fixes); age 1 means that the current run and the previous run has the same result but the result before the previous one is different Newis a shortcut to setAgebetween 0 and 0, ie. show changes that happened in the last run (fixes + regressions)- by
Instabilitywhere instability is a count of result status changes in the last 10 runs; if this is 0 then in the last 10 runs test case has the same result (it was pretty stable); if this is 10 then it means that in every run of the last 10 runs the status was changing compared to the previous one (it was very unstable) - by
Test Casename - by
Jobname of ID
Example 1:
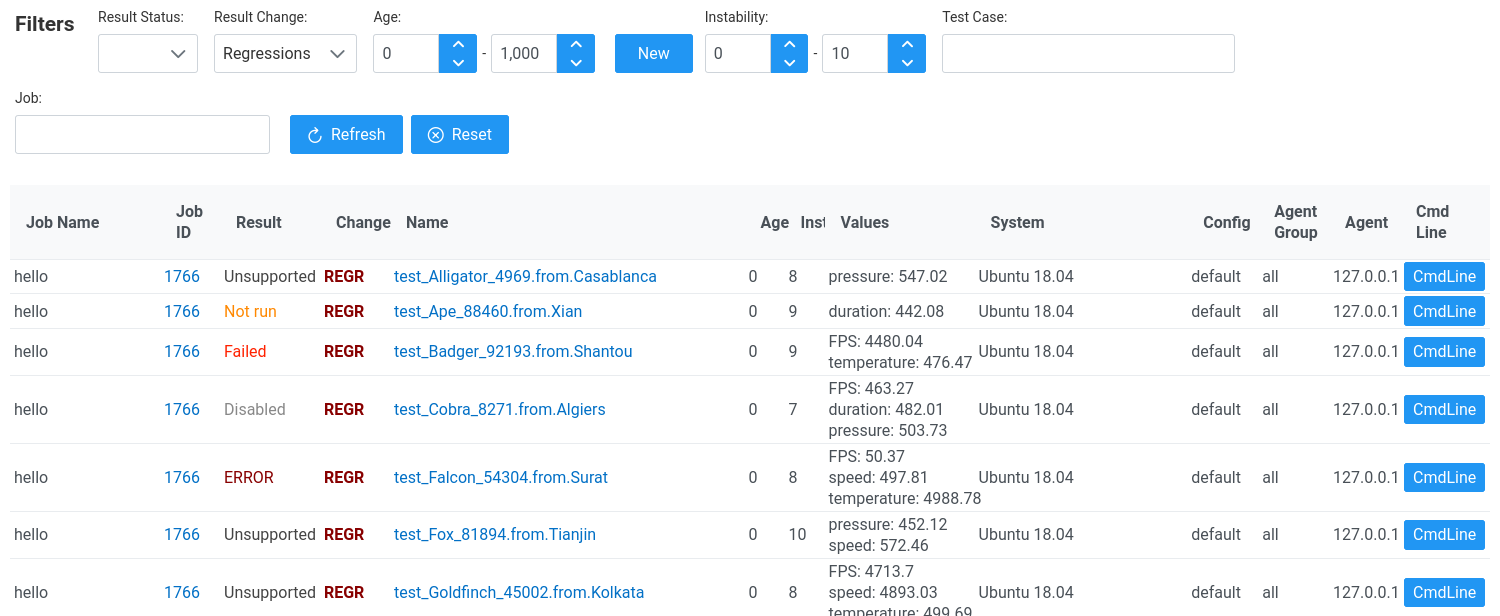
Filtering by Result Changes: show only regressions. Regression means
a change from non-passed status to passed status.
Example 2:
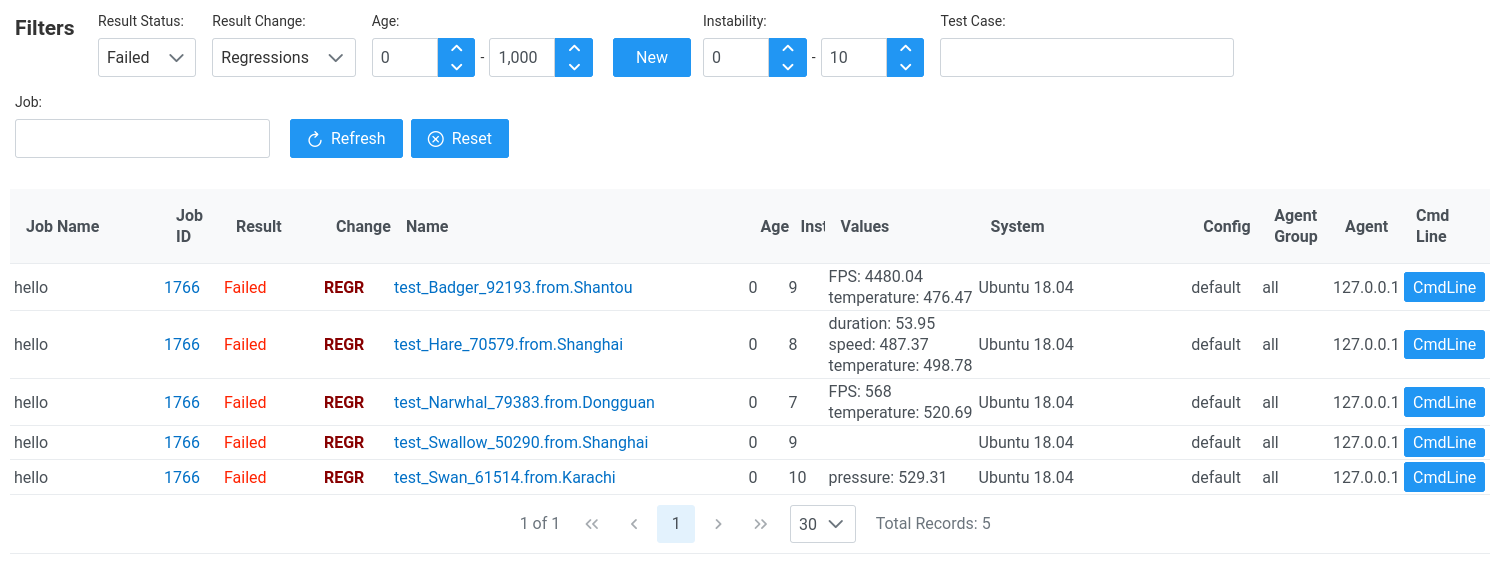
Filtering by Result Status and Result Changes: show only failures
that are regressions.
Example 3:
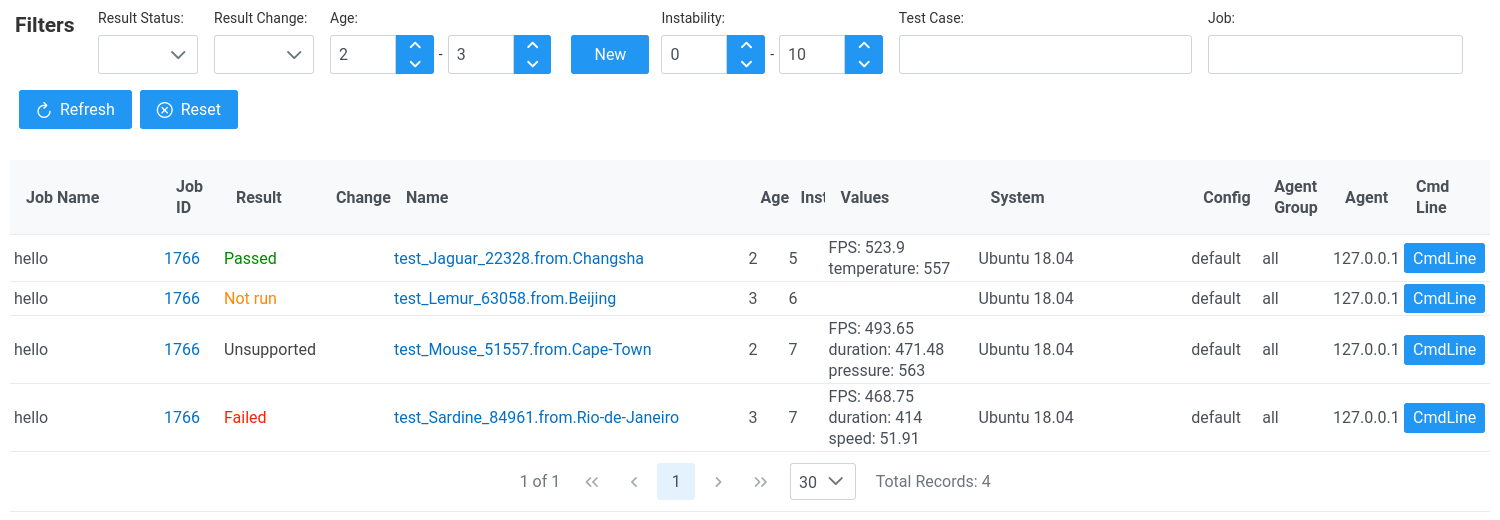
Filtering by Age: show only results in age between 2 and 3.
Example 4:
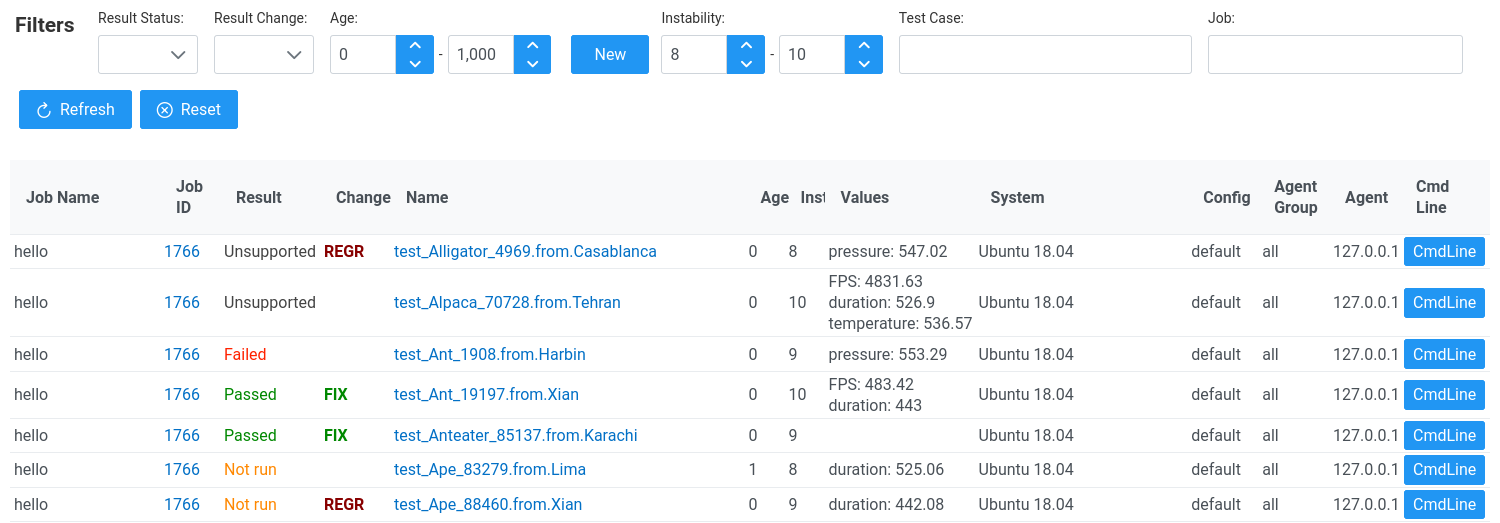
Filtering by Instability: show only results that have instability
greater than 7 i.e. very unstable test cases.
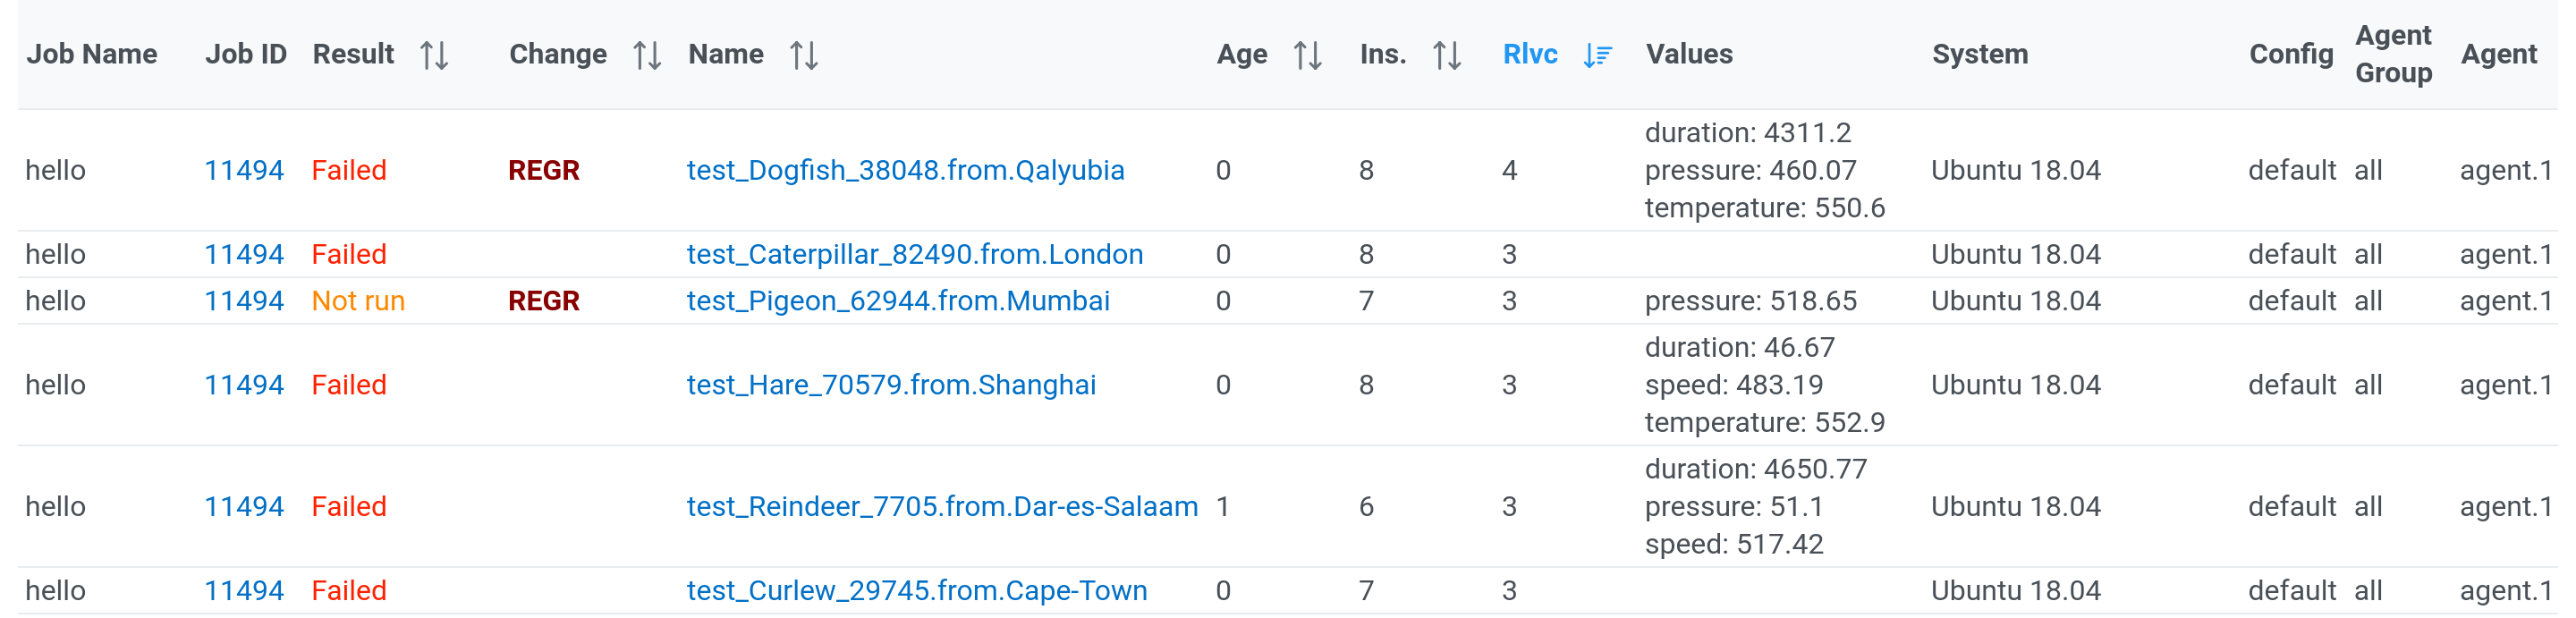
Sorting Test Case Results
Test case results can be sorted. This can be done using several columns:
- name
- result
- change
- age
- instability
- relevancy
By default results are sorted by test case name.
One of the most important sorting order is by Relevancy.
Relevancy is estimated according to this rules:
- 0 is initial
- +1 for not passed
- +1 for not root caused problem
- +1 for failure
- +1 for instability
<=3 - +1 for age < 5
- +1 for regression
This way the most relevant results get the highest score. They need an attention.
Comments
In the test case results table, it is possible to add sticky comments to test case results. When a new failure is spotted, a comment stating, e.g. the reason for the failure or link to a bug in a bug tracker may be added.
To add a comment, click on the cell of a particular test case result in
the Comment or Comment State columns.
This will reveal a dialog box that shows a form for introducing new comment and a history of previous comments related to this test case.
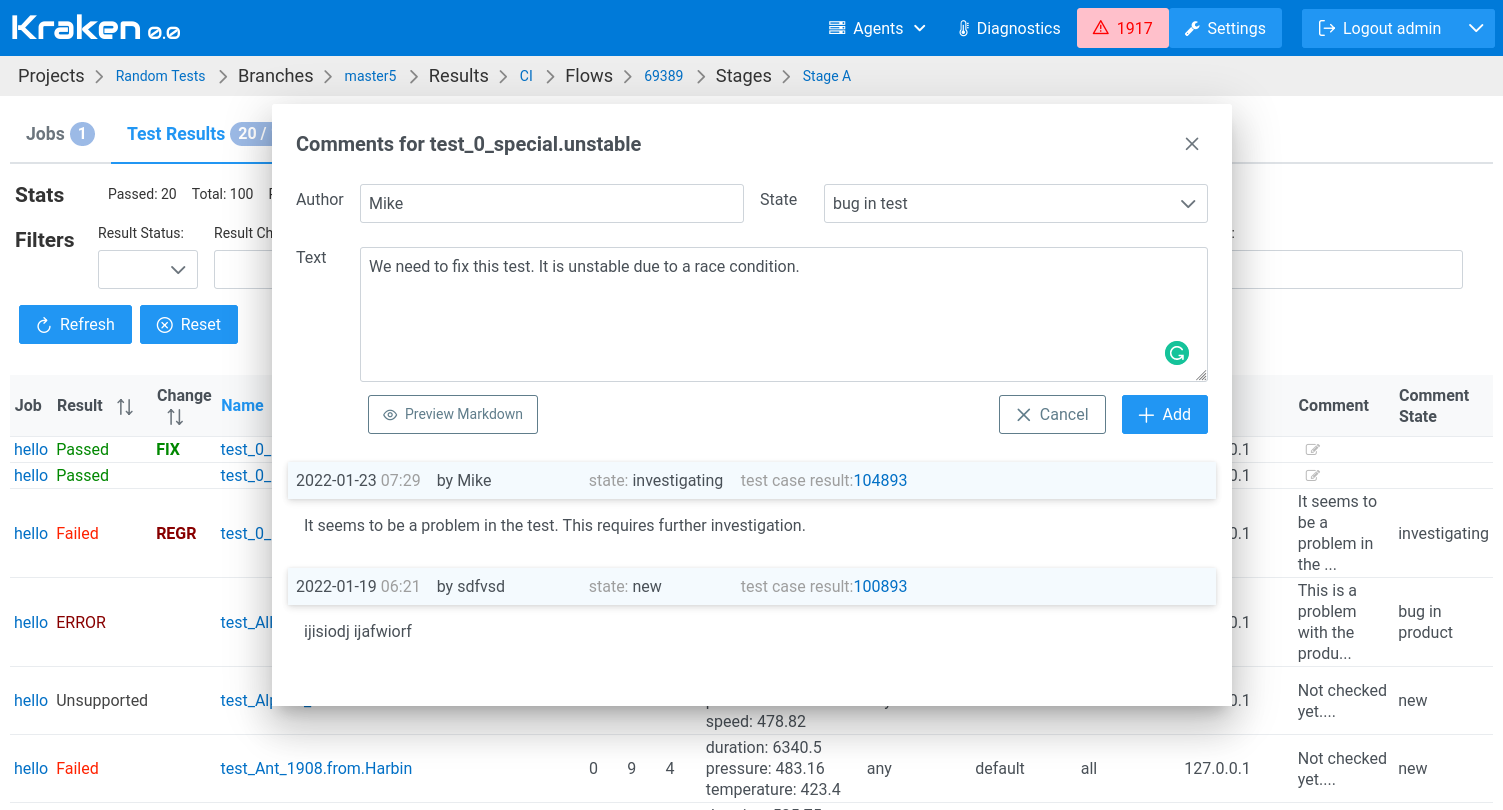
Each comment has a state. It can be one of:
newinvestigatingbug in productbug in test
The state allows concluding quickly if given failure has been analyzed and it is known where is the root cause and what needs to be fixed or if the failure still requires some investigation.
If a failure is root-caused, then its relevancy is decreased by 1.
If the failure persists in the subsequent test runs, the added comment is still presented next to the new results. If new facts about the failure are revealed, you may extend the comment.
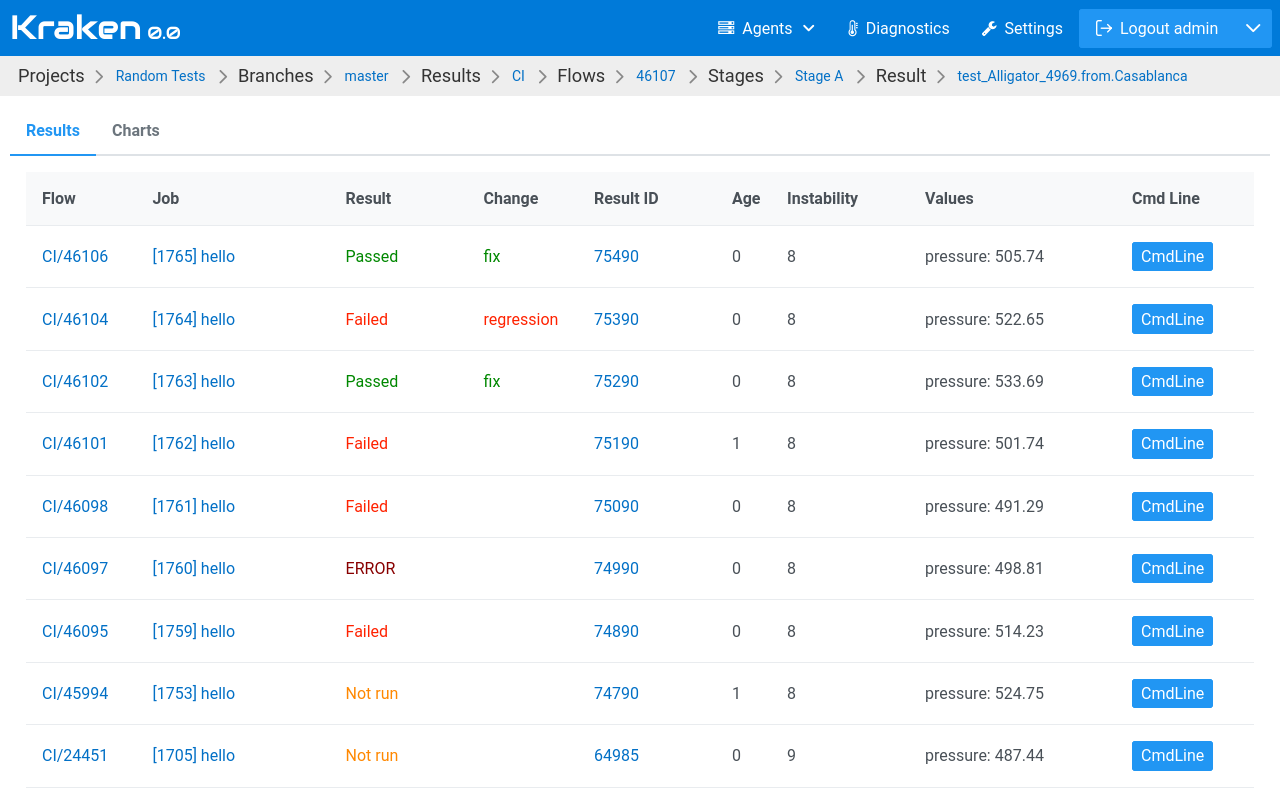
Test Case History
Each test case has its history of results. In the table with test case results a link under the test case name leads to a page dedicated to the given test case. This page presents a table with the historical results of the test case.
There is another tab called Charts that shows these results on charts.
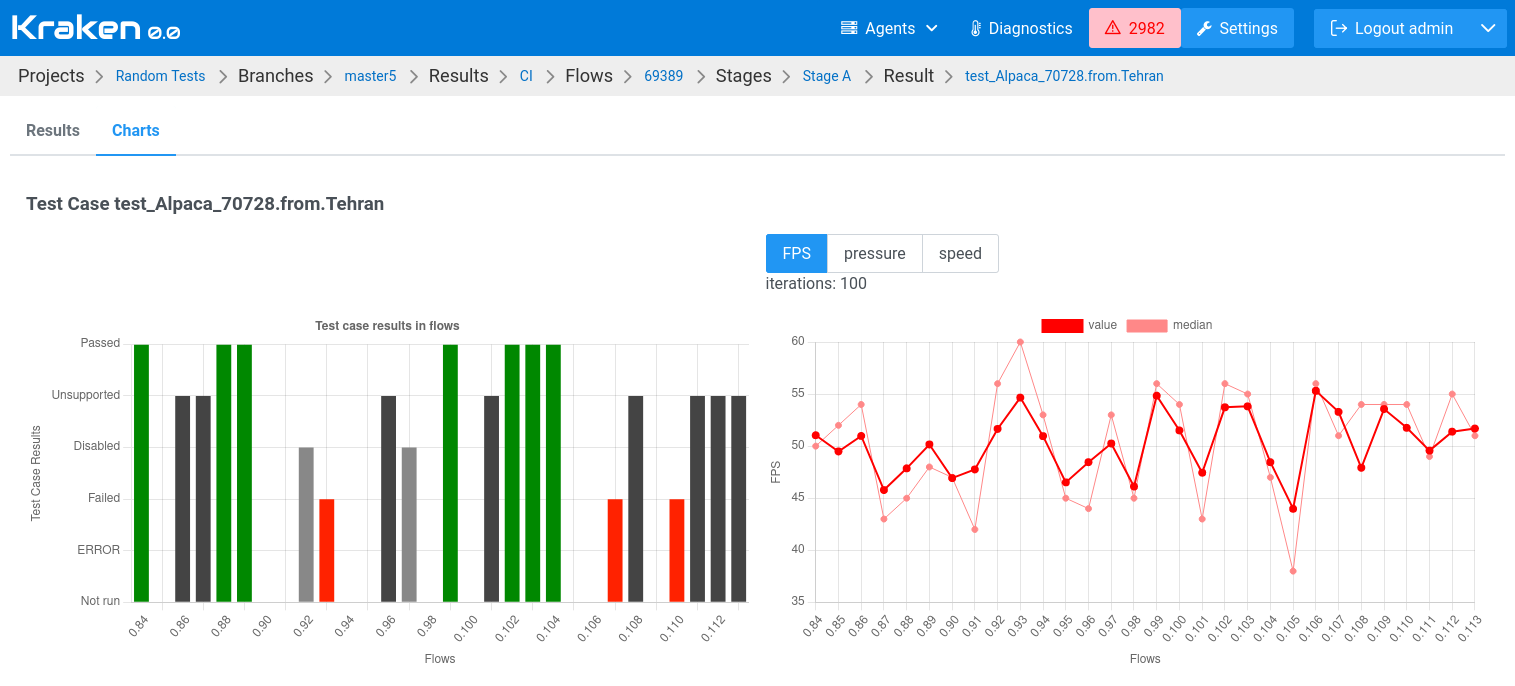
The left chart shows the history of result status. The right one presents the history of values in time. Error bars are shown if there were run multiple iterations and there were reported multiple values for a given attribute.